Mongo
Senior Member
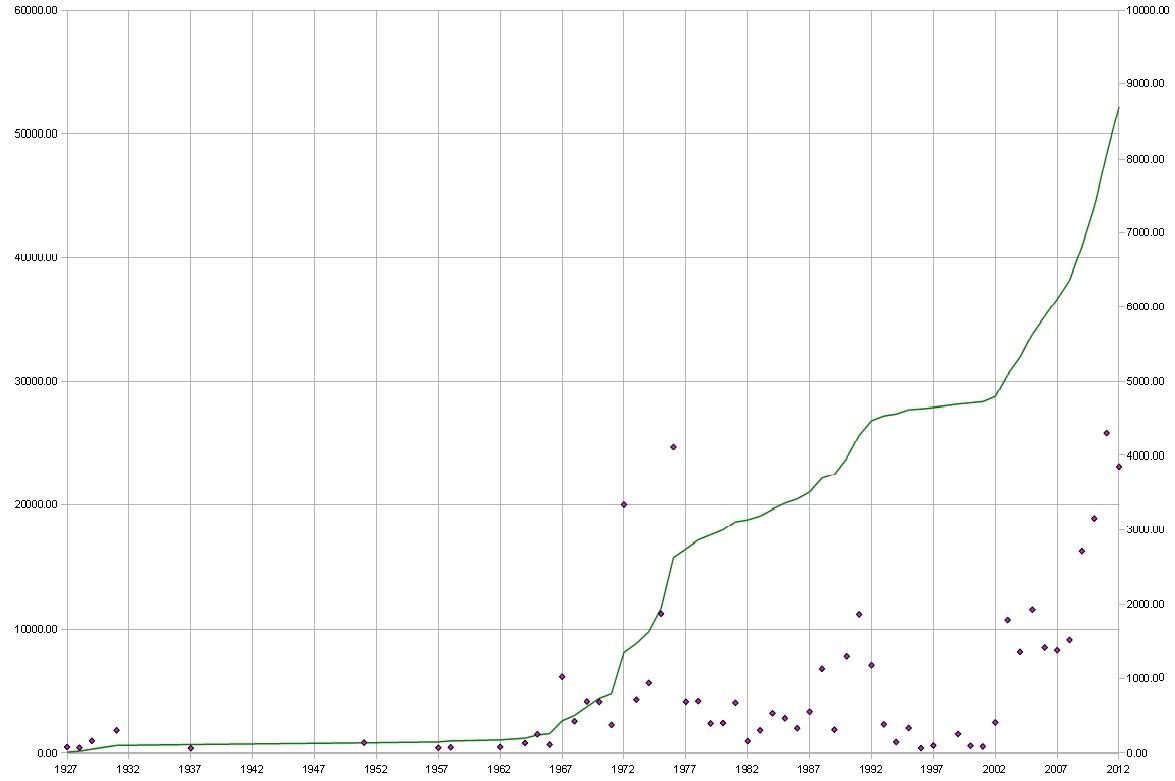
We all know that we are in the middle of a very large construction boom in Toronto, but how does it truly compare to previous booms? This is what I have attempted to answer in this study.
I set a lower cut-off of 300 feet (I could have used metres, but feet give a somewhat finer "grain" of heights), and entered every habitable building built in Toronto of at least that height (plus the CN Tower) into a spreadsheet. For each building, I had the spreadsheet calculate the square of the height, divided by 1000 (so that a 1000' building would score at 1000, and a 300' building would score at 90), and added the scores for each building 300' or over completed in a given year. I then added the yearly scores for each of the three major booms (1965-1981, 1983-1995, 2003-2016?), and normalized each one to the 1965-1981 boom at 100%.
1965-1981 100.00%
1983-1995 54.00%
2003-2010 100.43%
2011-2016? 215.66%
So far in the current boom, we have just now surpassed the 1965-1981 boom by this measure (in half the number of years), and are not yet 1/3 of the way through the known buildings with a known height in this boom. We are set to almost triple the Toronto highrise total score as it was at the end of 2002 by the year 2016. I am sure that many of the proposed buildings will have their heights reduced from the currently proposed heights, or even not be built at all, but the list does not include the Signature or Canada towers, or any project currently under wraps (I am aware of several such projects), so I would expect at least as impressive a total score in the coming years.
The 20 most productive years (to 2012):
1976 3976.38 (including the CN Tower)
2011 3745.43
2012 3640.82
2010 2714.78
2009 2632.44
1972 1986.67
2005 1860.43
1991 1654.30
1975 1612.82
2008 1287.07
2006 1123.73
2003 1112.93
2007 1058.89
2004 980.94
1988 914.73
1990 893.00
1992 752.45
1974 724.46
1976 682.16 (not including the CN Tower)
1967 650.64
1981 536.60
In addition, the four years 2013-2016 would each reach over 4000 by this measure, if all the proposed projects are built. This level of sustained highrise construction has happened in only two other cities in North America: New York City and Chicago. Toronto is in the process of joining them.
Last edited: