Yeah, the year by year changes are heavily tweaked by erroneous counting, natural variation, etc. It's better to look at a multi-year period. The University line's figures were perhaps static for a few years and only now updated, 'causing' huge increases. Perhaps there was a blizzard the day they counted at Downsview or the SRT, or they did it on a day when few students were going to school, like in June or December (both are heavily used by post-secondary students). Obviously, they can't count every station at the same time, on the same day as last year, and all in perfect conditions. Collectors fall asleep or leave the gates open and wander off, people flash their Metropasses, etc. Someone standing there clicking a counter may stop and chat to a lost traveller or harass some loiterers. Union, in particular, seems to have been flat for too long and this number seems more realistic...many bus routes are listed with identical riderships year after year. Makes you wonder if some of these counts are estimated.
I wonder what an acceptable level of fluctuation is...10%? 50,000 one day could be 42,000 or 53,000 the next day and that could be totally normal. A graph-savvy person might reap interesting results if they used several years of data...
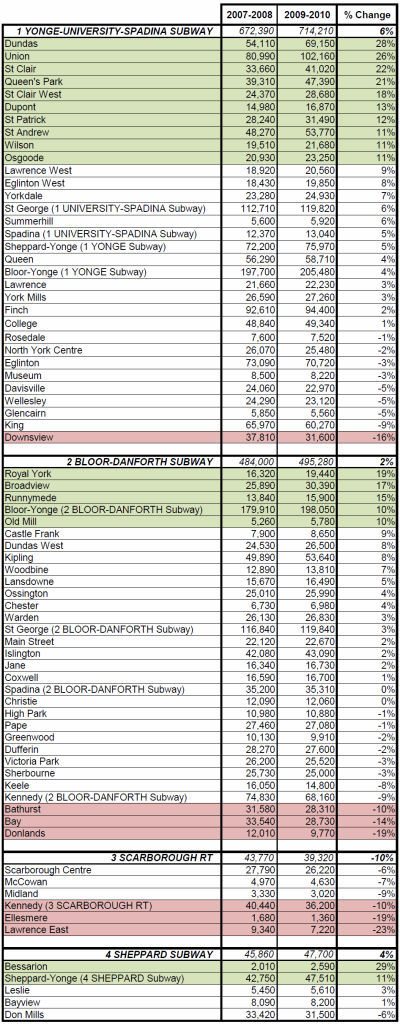
Bessarion will almost undoubtedly lead in percentage growth over the next decade as ParkPlace is built. The only competition would be Ellesmere, if the York Mills bus made a real connection to the station.