News   GLOBAL  |  Apr 02, 2020
 9.8K     0 
News   GLOBAL  |  Apr 01, 2020
 41K     0 
News   GLOBAL  |  Apr 01, 2020
 5.6K     0 

https://www.thestar.com/news/gta/2018/09/04/city-begins-installing-photo-radar-in-school-zones.html

Some other small but meaningful safety improvements for school zones may include curb bump outs and speed bumps. Having driven through areas with both of these, I can say they are highly effective in forcing one to slow down. We also need much better lighting at pedestrian crossings, better sight lines for drivers, and pedestrian friendly corner geometry/turn radii. Speaking as a driver, I would feel safer if pedestrians had better infrastructure. Most pedestrian crossings make me shudder when I'm driving in the evening.
All common sense, but that's what seems to be missing in a lot of what happens on the streets.
 
Where do you draw the line on that type of faulty reasoning?

Why wait in line if some just barge in? Why talk in a reasonable tone when others might shout? Why show good manners when some are rude?

Why even wipe yourself and wash your hands if others don't?
Sorry, but it doesn't sound faulty to me. Speed kills because of recklessness. Please tell me how that is incorrect in your opinion. No photo radar will stop idiot drivers from doing dangerous things.

If you wish to go philosophical, there are a whole range of different situations you can debate on where to draw the line and what constitutes as "faulty" reasoning. There is no need to correct other's opinion.
 
Speed kills because of recklessness.
Speed kills because of lack of sufficient response time. Recklessness just exacerbates it.

You can dismiss physics and facts all you like, it doesn't make you right.

Why speed kills
Speed is a major contributory factor in about a third of all road collisions. This means that each year excessive and inappropriate speed contributes to the death of around 850 people and to injure over 33,000 more. This is far more than any other single contributor to casualties on our roads.

In urban areas, pedestrians and cyclists are the majority of speed casualties, especially children. This should come as no surprise as this is where most of the population live. The largest group overall are car passengers and drivers themselves, especially on rural roads.

So how fast is too fast?
If we all drove expecting that we might have to stop suddenly, our speed would be more suited to the conditions.

Driving that bit slower will:
  • Give more time to spot the problems
  • Give more time to react
  • Give more space to stop in, by reducing our stopping distance
  • Cost us less in fuel
  • Help reduce pollution
  • Help reduce stress levels
  • Give a better chance of survival to anyone we hit!
stopping%20distances_497x165.jpg


http://www.staffssaferroads.co.uk/know-your-limits/why-speed-kills

Managing Speed,” a new report released by the World Health Organization (WHO) that addresses the dangers of excessive or inappropriate speed.

“Speed is at the core of the global road traffic injury problem,” Dr. Margaret Chan, Director-General of the WHO, said in a statement. “If countries were to address just this key risk, they would soon reap the rewards of safer roads, both in terms of lives saved and increases in walking and cycling, with profound and lasting effects on health.”

The report, which corresponds with the Fourth UN Global Road Safety Week being held from May 8-14 2017, offers guidelines to help manage the threat posed by speed. These include: building or modifying roads to include features that calm traffic, like roundabouts and speed bumps; establishing speed limits that are appropriate to the function of each road; installing in-vehicle technologies in new cars, like intelligent speed assistance and autonomous emergency braking; and improving enforcement.

The reported noted that a 5% cut in average speed can result in a 30% reduction in the number of fatal road traffic crashes, and pedestrians have a 90% chance of survival if hit by a car travelling at a speed of 30km/h (about 19 mph) or below, but less than a 50% chance of surviving an impact of 45km/h (about 28 mph) or above. And drivers who are male, young and under the influence of alcohol are more likely to be involved in speed-related crashes.

Road traffic fatality rates are nearly three times lower in Europe compared to Africa, the report said, and countries that have had the most success in drastically reducing rates deaths and injuries in recent decades – including Netherlands, Sweden, and the United Kingdom – have addressed the issue holistically by prioritizing safety in speed as well as with roads and roadsides, vehicles, and road users.

The benefits of reducing speed have a ripple effect, the report notes, as cities transform into more livable places: more people walk and bike and there are reductions in air and noise pollution, which have positive health benefits on rates of cardiovascular disease, cancer, diabetes and other noncommunicable diseases.

Hundreds of events to commemorate the week are being held around the world to draw attention to the dangers of speed as a leading risk for road traffic deaths and injuries.

To access the report and other materials, click here and here.
https://www.forbes.com/sites/gradso...critical-to-success-tina-nguyen/#218e2b2b3c36
 
Last edited:
I'll assume you mean 'reaction' time or perception/reaction time. Otherwise, the statement kinda lost me.
Same thing:
Reaction time or response time refers to the amount of time that takes places between when we perceive something to when we respond to it. It is the ability to detect, process, and respond to a stimulus.
Response time or Reaction Time- Cognitive Ability - CogniFit

https://www.cognifit.com/science/cognitive-skills/response-time

1.) Driver Reaction Times (tr)
Driver reaction time includes recognizing the light has changed, deciding to continue or brake, and if stopping engaging the brake (remove foot from accelerator and apply brake). Reaction times vary greatly with situation and from person to person between about 0.7 to 3 seconds (sec or s) or more. Some accident reconstruction specialists use 1.5 seconds. A controlled study in 2000 (IEA2000_ABS51.pdf) found average driver reaction brake time to be 2.3 seconds. The study included all driver types, test were conducted on a controlled track and in a driving simulator.

Driver Reaction Times
0.7 sec -- about as fast as it gets
1.0 sec -- old standard
1.5 sec -- common use
2.0 sec -- common use
2.3 sec -- AVERAGE
2.5 sec -- used in a few states
3.0 sec -- NSC and UK Standard
https://copradar.com/redlight/factors/
 
More Mass Transit Riders Mean Fewer Traffic Deaths, Study Shows

See link.

Public transit is 10 times safer, per mile, than traveling by car. This is part of the findings included in a recent report by the American Public Transportation Association (APTA).

The analysis examined data by the National Highway Traffic Safety Administration and the Federal Transit Administration, and was a project jointly led by APTA and the Vision Zero Foundation.

"Overall, the research shows that metro areas with higher public transportation use have lower roadway traffic fatality rates," said Paul Skoutelas, APTA president and CEO, in a conference call with reporters Aug. 29.

The study comes as more communities adopt Vision Zero transportation planning, which aims to eliminate all traffic deaths and severe injuries. The movement began some 20 years ago in Sweden and has since been adopted by more than 30 communities in the United States.

New York and San Francisco -- two major cities adopting Vision Zero policies -- have seen traffic deaths reduced 28 percent and 41 percent respectively in the last four years.

Vision Zero was established in San Francisco in 2014, following the deaths of seven pedestrians in December 2013.

"There was a recognition at that point in our city that we were no longer going to accept the fact that people are going to get killed just as they try to get around the streets of San Francisco," said Ed Reiskin, director of transportation at the San Francisco Municipal Transportation Agency, during the call.

Vison Zero, which addresses policy directions, education, traffic enforcement and other areas, is a partnership among a number of city agencies in San Francisco, as well as community organizations.

Prior to Vision Zero, about 30 traffic-related fatalities occurred in San Francisco annually, said Reiskin. In 2017, that statistic was reduced to 20.

"That was the lowest number of traffic fatalities in San Francisco since we started keeping track of that statistic, I think in 1915," he remarked.

An analysis found that 13 percent of streets in san Francisco are home to 75 percent of the severe and fatal traffic collisions. By taking a close look at where fatalities happen in San Francisco, the city has been able to refocus street design and other efforts to make the routes safer for not only motorists, but pedestrians and cyclists as well, Reiskin said.

The National Highway Traffic Safety Administration reported more than 37,400 traffic deaths in 2016, a 5.6 percent increase above the previous year. And the number of traffic deaths per 100,000 people in major cities tend to fall as the number of transit trips per capita increases.

"Simply put, a small increase in public transit use can result in a dramatic decrease in traffic fatalities," Skoutelas said.

The study shows that in cities with public transit, traffic fatalities can be reduced 40 percent when residents increase their public transit trips to 40 annual trips per capita from 20 trips per capita.

Transit provides an option for riskier drivers -- inexperienced, distracted, drowsy or elderly -- which when used, can help to make roadways safer, say experts.

"Public transit even benefits those who do not use it and are otherwise safe drivers and reduces the risk of being the victim of other drivers' mistakes," said Bella Dinh-Zarr, member of the National Transportation Safety Board.
 

The article on Pontevedra I think lays out the case beautifully for a thoughtful, strategic move away from car-dominated roads in favour of better balance.

It illustrates the need to phase in change and transition, and to continue to accommodate drivers........up to a point.

Whether that is new parking areas at the limits of where you want to allow car traffic, or whether that is building in exceptions for weddings and funerals.

It shows the need for thoughtful sensitivity.

If I were to take that example and apply in Toronto, I would suggest that it makes the case for changing Yonge (downtown) first, but only reducing car lanes to two from four.

Then trimming down University by 2 lanes, in both cases adding cycling facilities and more and better walking space.

Get Line ATC up and running and strategically add capacity at the busiest stations (Yonge-Bloor, new exits at College and Dundas, and somehow, more room at King)

Then tackle interior streets in older areas like the St. Lawrence area, treating them like Market Street, cars allowed, but w/reduced room, attractive pavers, wider , beautified sidewalks and so on.

If you can formulate a plan that says in 10 years we want downtown car traffic down by 1/3 and you make the requisite investments, you can get there with minimal opposition.

You then deepen the plan and roll it out to adjacent areas, and along the subway corridors.

One-off projects, in isolation can be a disaster, in as much as they often achieve too little to please anyone, and in the absence of a broader plan they don't necessarily cause any modal shift, just more congestion.
 
One problem in the inner, and sometimes outer, city is has are the poles used for street lamps.

From link.

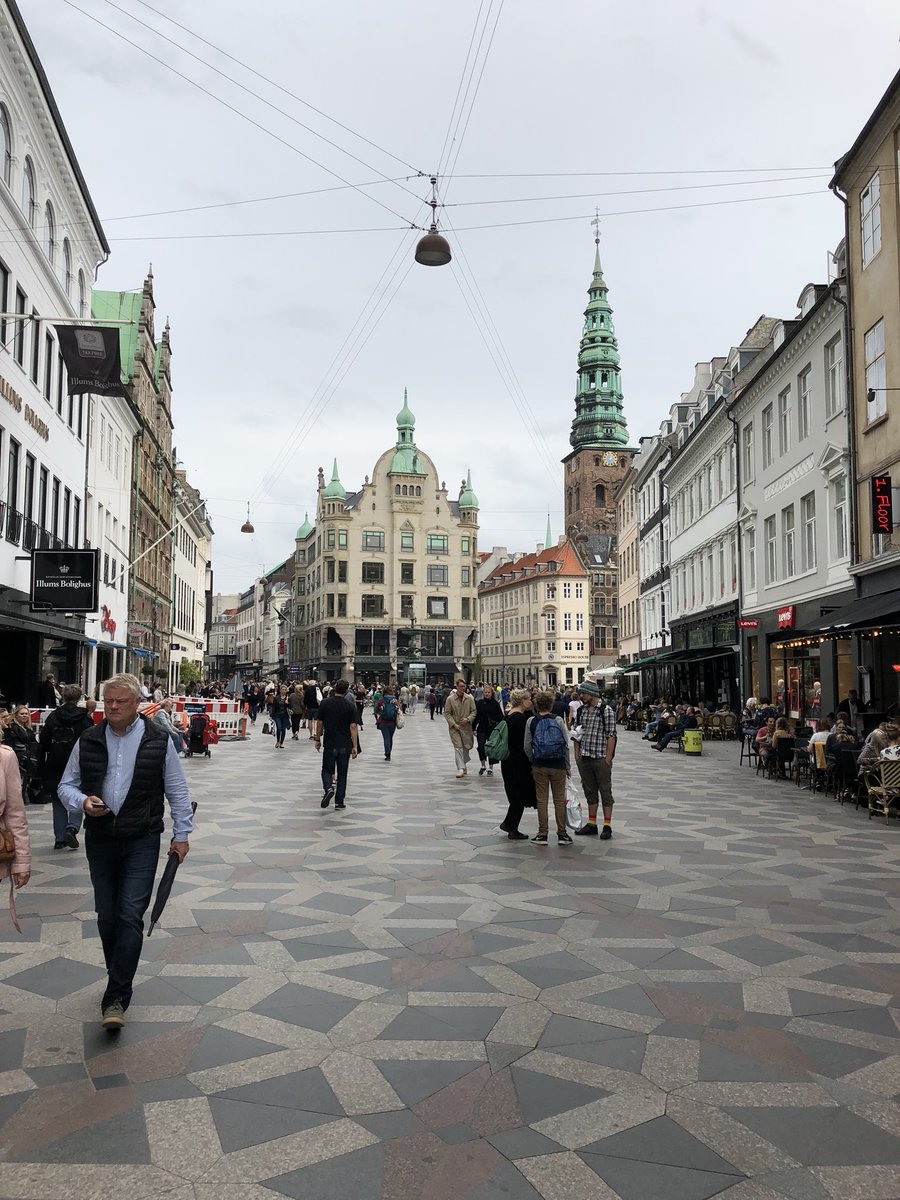
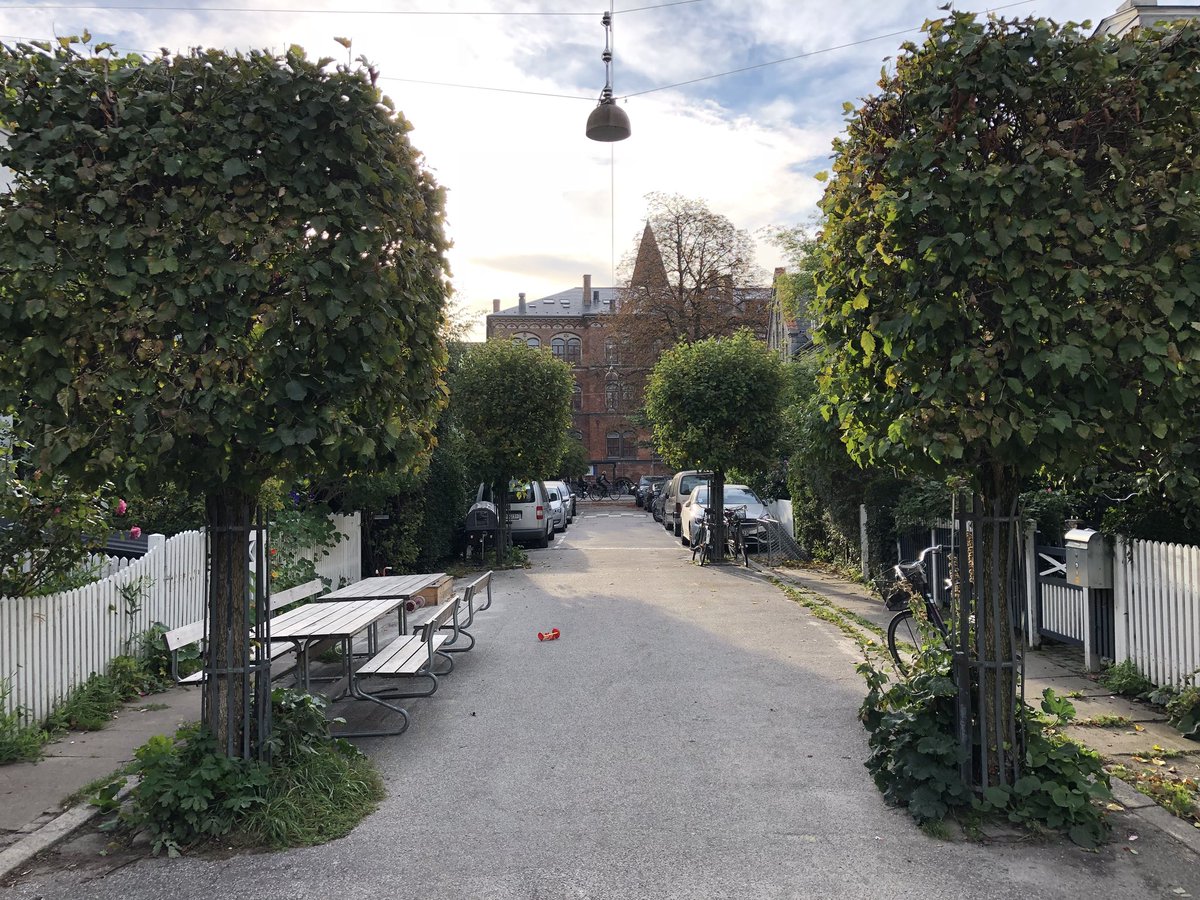
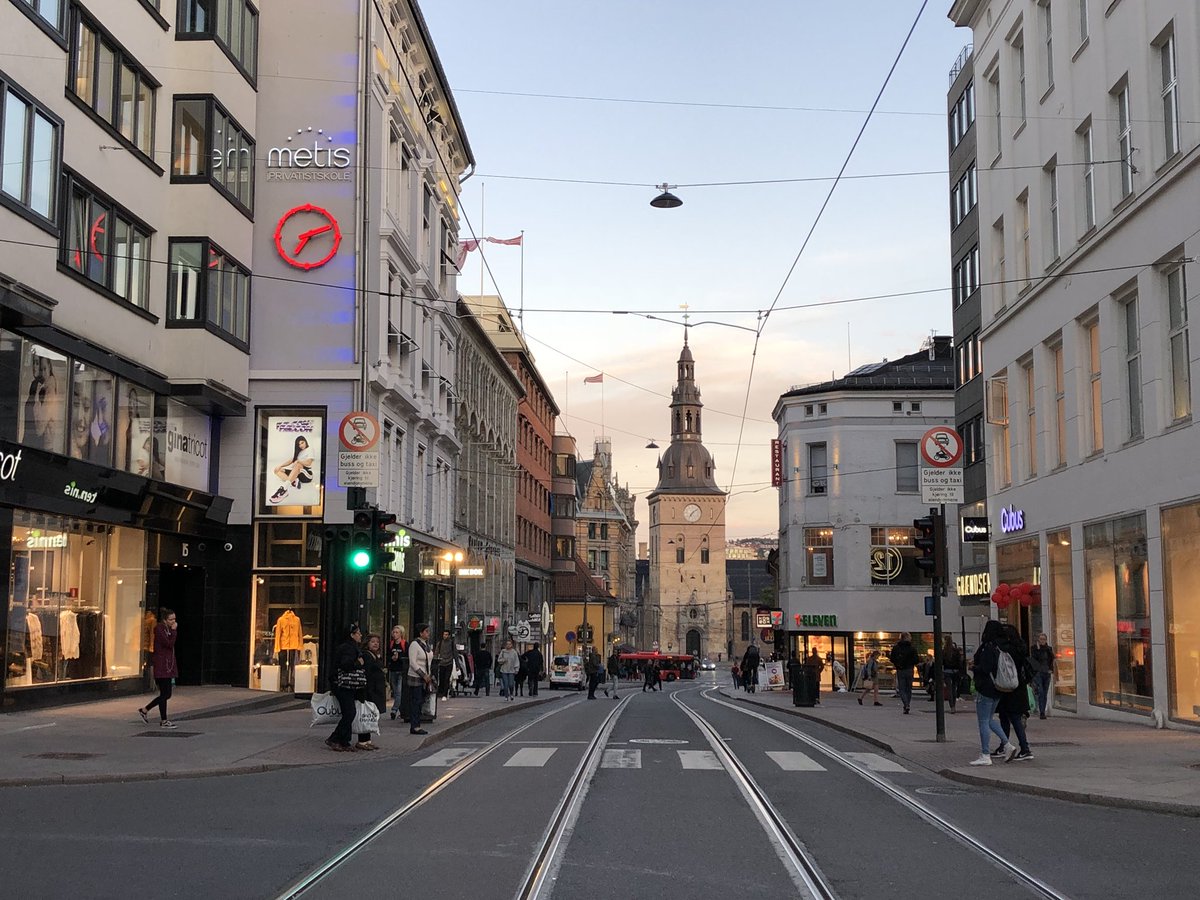
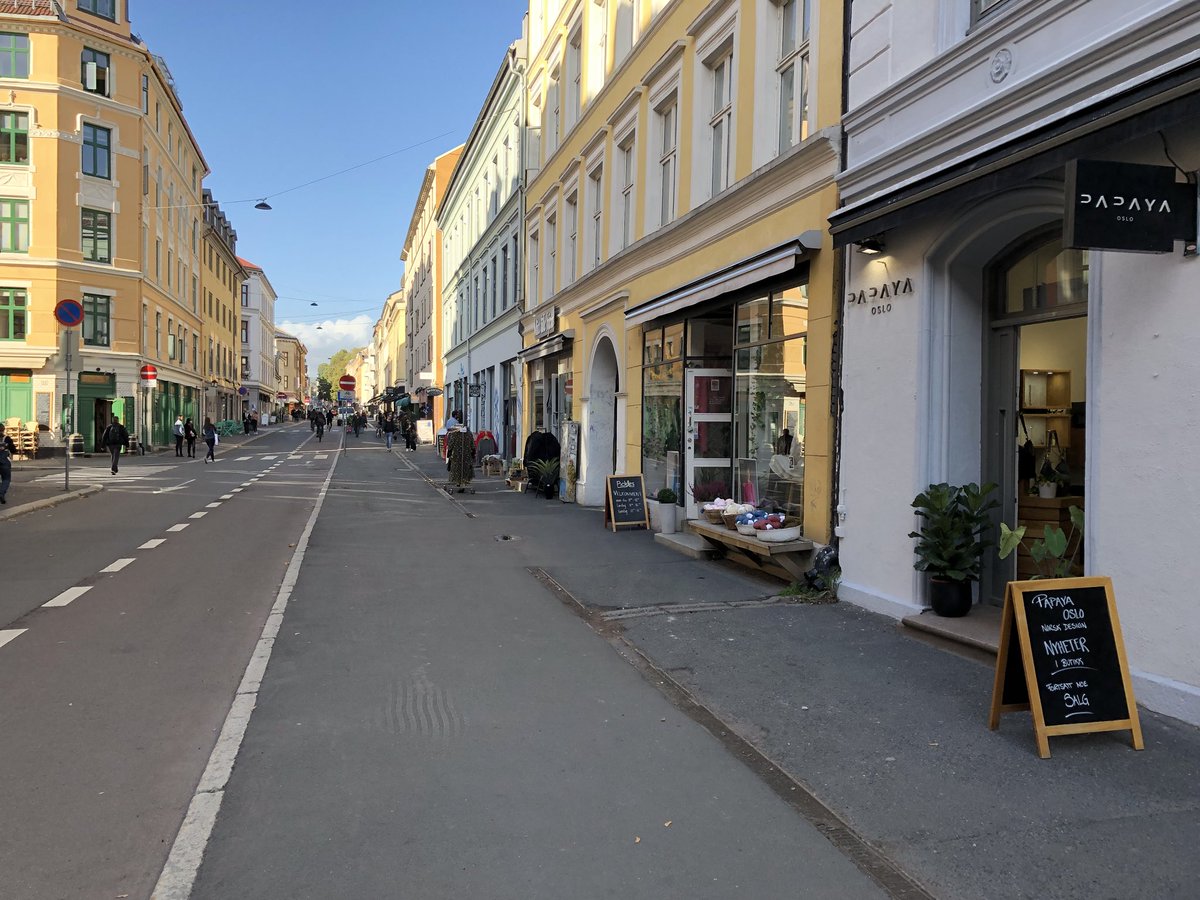
Stockholm, Helsinki, Oslo, and Copenhagen are all different but one of the most underrated design moves found in each of these cities is the prevalence of street lighting strung between buildings rather than street lamps cluttering the public realm. It creates more walkability.

DnphZlFXoAAA3AJ.jpg


DnphZlEXcAYvk6H.jpg


DnphZlDXgAIkW8G.jpg


DnphZlMXoAEhWQ_.jpg


Removing the poles would create more space for walking.
 
One problem in the inner, and sometimes outer, city is has are the poles used for street lamps.

From link.


DnphZlFXoAAA3AJ.jpg


DnphZlEXcAYvk6H.jpg


DnphZlDXgAIkW8G.jpg


DnphZlMXoAEhWQ_.jpg


Removing the poles would create more space for walking.

This illustrates the problem of conflicting objectives in an interesting way.

I think walkability is a very important civic value.

But I also want to see greatly reduced light pollution.

To achieve the latter, you generally need lighting much closer to ground level, well below typical building height (though you could attach fixtures to buildings at a lower height).

But the typical solution requires more poles instead of less when you reduce height and focus the light more narrowly where its needed.

Though this may be partially offset by smaller/narrower) poles since they have a great deal less weight to support.
 
One problem in the inner, and sometimes outer, city is has are the poles used for street lamps.

From link.


DnphZlFXoAAA3AJ.jpg


DnphZlEXcAYvk6H.jpg


DnphZlDXgAIkW8G.jpg


DnphZlMXoAEhWQ_.jpg


Removing the poles would create more space for walking.
Only problem here is too much suing and blaming when something goes wrong with the wiring. Heck hydro, TTC and Bell would need separate poles and can't touch each other's stuff. Stick the wire on a private building's wall and hell will break loose.
 
Only problem here is too much suing and blaming when something goes wrong with the wiring. Heck hydro, TTC and Bell would need separate poles and can't touch each other's stuff. Stick the wire on a private building's wall and hell will break loose.

Just create a law or by-law to get easement rights to do just that.
 
The only place we're currently suspending TTC span wire is on the AGO - and it looks great. There used to be street lamps directly affixed to buildings on Yonge Street south of Bloor after the subway was completed. All the wires were buried as well, and until the 1990s, traffic lights even were minimalist, affixed directly to short poles. It made for an uncluttered streetscape.
 

Back
Top