pman
Senior Member
^ Wow! Toronto is King! (of Canada and the U.S.)
Radio Canada newsreaders still sometimes refer to Toronto as "La ville reine", when they refer to us at all.
^ Wow! Toronto is King! (of Canada and the U.S.)
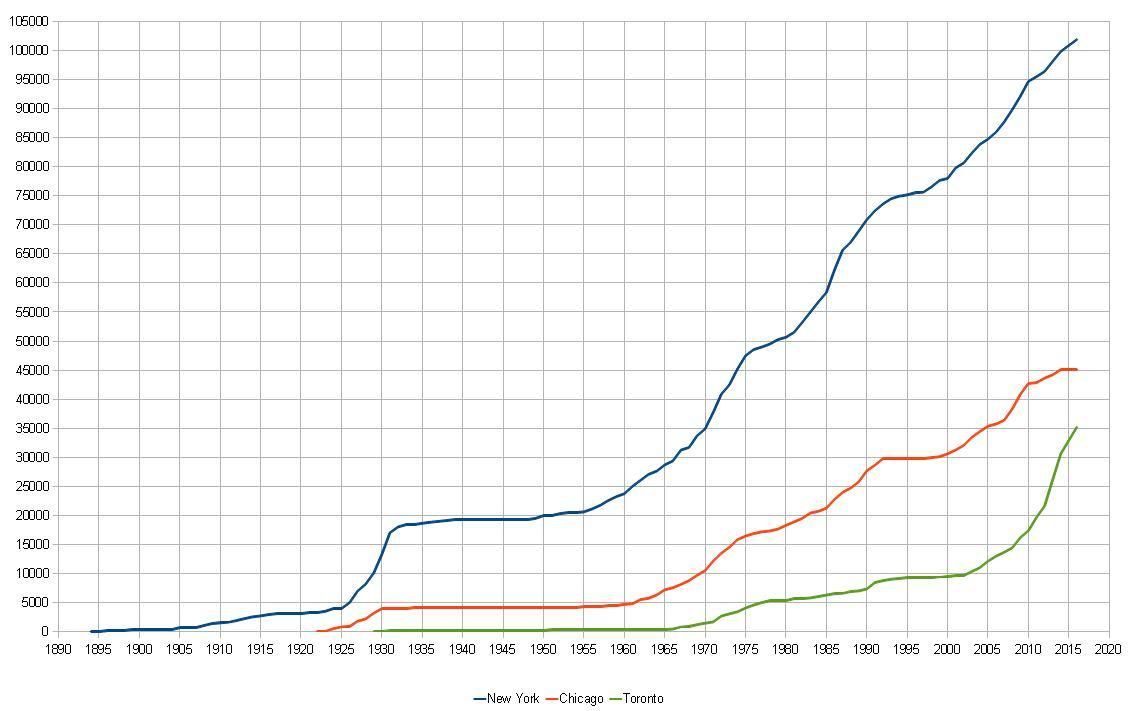
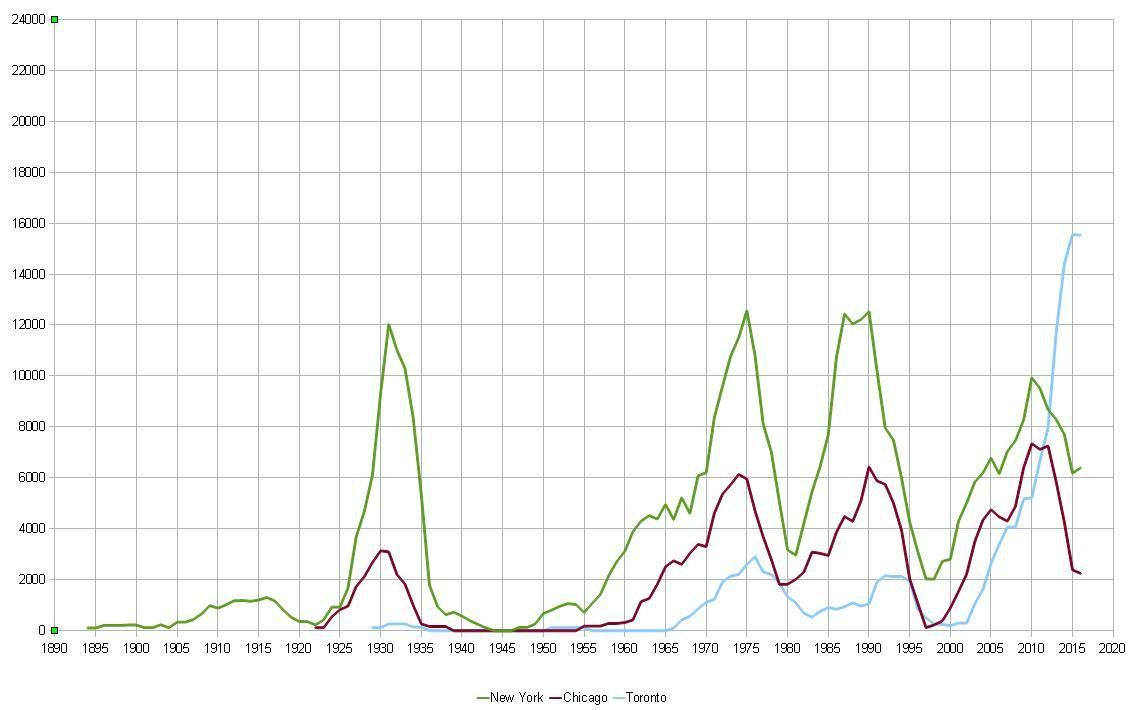
Okay, for this comparison I simply added up the roof heights in metres of all buildings under construction in the USA and Canada, that attained at least 100m. This gives an index of tall building construction activity, that accounts for differing roof heights. My source was SSP.
8508.6m (52.23%) -- 60 buildings -- Toronto + Mississauga, Ontario
3465.8m (21.28%) -- 16 buildings -- New York City, New York
1054.4m (6.47%) -- 8 buildings -- Chicago, Illinois
889.8m (5.46%) -- 7 buildings -- Vancouver + Burnaby + Surrey, British Colombia
259.1m (1.59%) -- 1 building -- Oklahoma City, Oklahoma
248.0m (1.52%) -- 2 buildings -- Montreal, Quebec
245.4m (1.51%) -- 2 buildings -- San Diego, California
236.0m (1.45%) -- 1 building -- Calgary, Alberta
216.4m (1.33%) -- 1 building -- Atlantic City, New Jersey
170.7m (1.05%) -- 1 building -- Dallas, Texas
135.0m (0.83%) -- 1 building -- Houston, Texas
128.3m (0.79%) -- 1 building -- South Padre Island, Texas
126.5m (0.78%) -- 1 building -- Phoenix, Arizona
118.9m (0.73%) -- 1 building -- Arlington, Virginia
113.0m (0.69%) -- 1 building -- Edmonton, Alberta
112.6m (0.69%) -- 1 building -- Detroit, Michigan
109.1m (0.67%) -- 1 building -- Raleigh, North Carolina
Radio Canada newsreaders still sometimes refer to Toronto as "La ville reine", when they refer to us at all.
No, we just let them shoot each other in North York Or York.Canada, China, Toronto, Beijing whatever...id take Canada and Toronto anyday, at least we dont run over children and leave them out to die.
you pasted this from that thread but you didnt read the next few posts pointing out how inaccurate it is.


